Dynamic light scattering

     Dynamic light scattering is the measurement of fluctuations in scattered light intensity with time. These fluctuations in intensity arise due to the random Brownian motion of the nanoparticles. Therefore, the statistical behavior of these fluctuations in scattered intensity can be related to the diffusion of the particles. Since larger particles diffuse more slowly than small particles one can readily relate particle size to the measured fluctuations in light scattering intensity. With modern instruments such as the SZ-100 the technique is rapid and reliable.

clr1

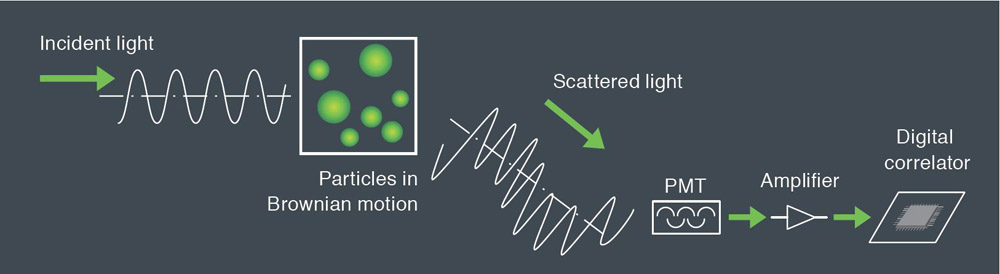
     Larger particles in Brownian motion have smaller rate than smaller. The scattered light from the particles is detected as a signal to the fluctuations corresponding to speeds of Brownian motion of particles. The resulting signal is analyzed using correlation spectroscopy, the autocorrelation function is calculated and based on this construction the particle size distribution. The relationship between the autocorrelation function and the diameter of the nanoparticles:

crl2

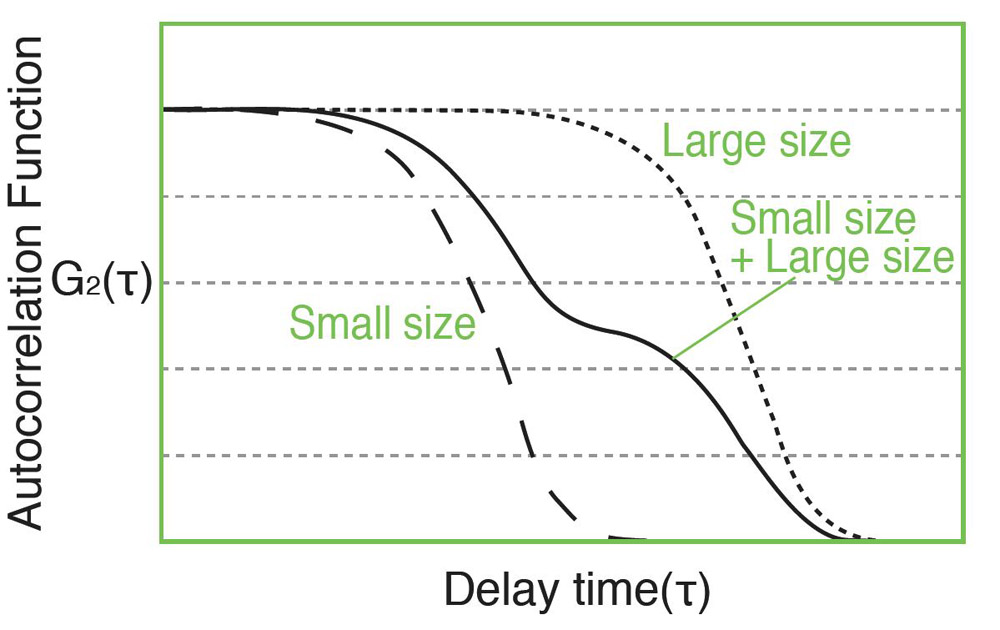
     Measurement of the autocorrelation function is done by comparing the scattered light intensity at some reference time t and after some delay time t. For a very short delay time. The particles have not had a chance to move and therefore the scattered light intensity is unlikely to change much. So, the autocorrelation function has a high value. For a very delay time, the particles have had a chance to move significantly, and the autocorrelation function has a low value. This low value is related to the time average scattered intensity. The rapidity of this decay from high values to low values corresponds to the speed of particle motion and therefore to the particle size. The measured autocorrelation function has an exponential decay.


Overviews and methods


Under construction


Equipment

Laser particle analyzer SZ100


Contacts

The Leading Researcher in optical systems Alexandr Shimko

Specialist in spectroscopy and granulometry Anastasia Povolotckaia

Specialist in optical systems Alexandra Mikhaylova


Zeta potential measurement principle (Laser Doppler Electrophoresis)

Many nanoparticles or colloidal particles have a surface charge when they are suspension. When an electric field is applied, the particles move due to the interaction between the charged particle and applied field. The direction and velocity of the motion is a function of particle charge, the suspending medium, and the electric field strength. Particle velocity is then measured by observing the Doppler shift in the scattered light. The particle velocity is proportional to the electrical potential of the particle at the shear plane which is zeta potential. Thus, this optical measurement of the particle motion under an applied field can be used to the determine zeta potential.

dzeta1

Particle motion under an applied electric field is known as electrophoresis. The method used by SZ100 is known as laser Doppler electrophoresis. Sample particles are suspended in a solvent af known refractibe index n, velocity η and dielectric constant ε. The sample is irradiated with laser light of wavelength λ. An electric field with strength E is applied. Due to the electric field, the particles are moving. Since the particles are moving, the scattered light at angle ϑ is measured and the particle velocity V is determined from the frequency shift. Mobility is then readily obtained as the radio of velocity to electric field strength V/E. Zeta potential is then found mobility using a model, the most common of which is the Smulochowski model.

dzeta3

The following equation is used for the relationship between the calculated electrical mobility and zeta potential.

dzeta2


dzeta4

where ζ – Zeta potential, U – Electrical mobility, E – Electric field strength, ε – Solvent dielectric constant, n – Solvent refraction index, η – Solvent viscosity, f(ka) – henry coefficient


Overviews and methods


Under construction


Equipment

Laser particle analyzer SZ100


Contacts

The Leading Researcher in optical systems Alexandr Shimko

Specialist in spectroscopy and granulometry Anastasia Povolotckaia

Specialist in optical systems Alexandra Mikhaylova


Absorption spectroscopy

Absorption spectroscopy is used to obtain the absorption spectra (transmission), diffuse scattering and measurement of the optical density of matter in different states of aggregation in the ultraviolet, visible and near-infrared regions of the spectrum. This method is used to the vast majority of information about the structure of the material at the atomic and molecular level, how atoms and molecules behave when combined in condensed matter. Feature of optical spectroscopy compared to other types of spectroscopy is most structurally organized matter (larger atoms) interacts resonantly with the electromagnetic field in an optical frequency range. Therefore, optical spectroscopy is widely used for studying matter.

Also absorption spectroscopy is used:

- qualitative and quantitative analysis of the substance on the changes in the position, intensity and shape of the absorption bands;

- measurement of the reflectance spectra of samples;

- determination of the optical characteristics of the glass with a high absorption coefficient, optical elements with antireflection coatings, narrow-band (DWDM) filters, fiber optical communication components of flat panel displays, solar cell elements and their coatings, paints, color printing, etc.

Being a fairly simple and straightforward technique, absorption spectroscopy can give important information about the spatial structure of nano-objects.

pogle1

Transmission spectra of filters SZS7, SZS8 and SZS9

Overviews and methods


Under construction


Equipment

UV/Vis/NIR spectrophotometer Lambda 1050


Contacts

The Leading Researcher in optical systems Alexandr Shimko

Specialist in optical systems Alexandra Mikhaylova


Luminescence spectroscopy

ОFluorescent spectroscopy differ from other spectroscopic techniques because of the recorded spectral dependence is a function of two variables - the excitation wavelength λex and emission wavelength λem. If λex is kept constant and λem is scanned, the measured luminescence spectrum is emission (spectral dependence of the luminescent intensity on the wavelength). If you are scanning λex at constant λem, you measure excitation spectrum (spectral dependence of the excitation efficiency on the excitation wavelength).

Luminescence methods include studies using fluorescence and phosphorescence. Fluorescent measuring are the most widely used as methods for analysis and monitoring of chemical and biochemical reactions and kinetic studies for the fast reactions of electron-excited molecules.

Applications of luminescence spectroscopy for analytical purposes embrace identification of substances, detection of low concentrations of substances, control the changes of studied matter, determination the purity of compounds. Also luminescence studies are used to measure kinetics of conventional chemical reactions. The high sensitivity allows detecting the small degree of substances conversion and sometimes it is possible to establish the mechanism of chemical reaction.

Luminescent methods are used in biology, in particular for the study of protein structure by fluorescent probes and labels. Also they are successfully applied in the study of fast reactions of electronically excited molecules. Such reactions are accompanied by decreasing of fluorescence intensity due to fluorescence quenching. Quenching processes compete with the deactivation of the excited molecules by other mechanisms. Since the fluorescence decay time of about 10-8s, fluorescent methods are commonly used to study the kinetics of fast reactions of excited molecules that occur during a 10-7–10-10s.

lum1

Luminescence spectrum of YVO4:Eu 8 at.% nanopowder (λex = 300 nm)

Overviews and methods


Under construction


Equipment

Modular spectrofluorometerFluorolog-3

Fluorescence spectrometer Lumina


Contacts

The Leading Researcher in optical systems Alexandr Shimko

Specialist in spectrofluorimetry Ilya Kolesnikov

Specialist in spectroscopy and granulometry Anastasia Povolotckaia

Specialist in optical systems Alexandra Mikhaylova


The Fourier Transform Infrared Spectroscopy (FT-IR)

FT-IR spectroscopy (FT-IR) is a well-known and proven technology for analysis and identification of unknown chemicals. The method is based on a microscopic interaction between infrared light and a chemical substance by a process of absorption and results in a set of ranges, called the spectrum (the spectrum is unique for chemical substance and serves as a "molecular fingerprint"). Despite the fact that FT-IR - is widely applicable method, it uses the analysis of the chemical substances’ intrinsic properties, thanks to that FT-IR is very suitable for comparison with the spectral library. With the use of an extensive database, the comparison with the spectral library makes it possible to quickly identify thousands of chemicals on the base of their unique "molecular fingerprint".

Besides the absorption is the characteristic of the individual groups of atoms, its intensity is directly proportional to their concentration. Thus, by measuring the absorption intensity after a simple calculation provides the amount of this component in the sample.

In their capability method is almost universal. FTIR spectroscopy is used for determining the content of organic and inorganic substances and compounds in solid, liquid and gaseous samples (foods, soil, metals and their alloys, polymers, etc.).

furyee1

The absorption spectrum of the polyethylene glycol, filmed by FT-IR spectrometer Nicolet 8700

Reviews and methods


Under construction


Equipment

FT-IR spectrometer Nicolet 8700


Contacts

The Leading Researcher in optical systems Alexandr Shimko

Specialist in spectroscopy and granulometry Anastasia Povolotckaia


Переключение языков (offcanvas)